Ada features a strong predefined standard library covering a variety of disciplines. In particular the numerical libraries are a solid foundation for scientific and engineering computations. Combined with a comprehensive set of data structures lead to reliable applications.
In this chapter numerical libraries are surveyed.
5.1 Learning Objectives
Creating text files in comma (or :) separated format
Elementary numerical function library
Interfacing with a plotting tool through files
5.1.1 Related Tools
In this projectlet, in addition to the library itself, we expand our toolset to other tools to create graphical representations. Basic charting and plotting is a powerful beginning to understanding. While generating the plots directly from Ada is possible, the usage may be distracting at this stage. There are of course many possible tools for plotting, R, Julia, Octave being some popular Open Source packages. In this book, gnuplot is used as the preferred tool for plotting data sets. The output from all the application software is written to a CSV file which then is fed to gnuplot to produce these plots.
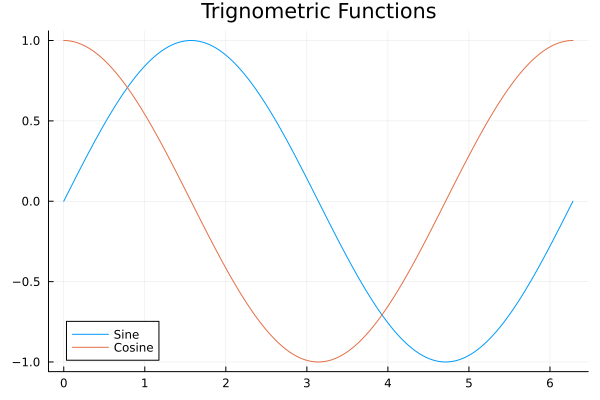
5.2 Sinusoid
Basic sinusoids are supported directly by the library.
0087 | CreateOutputFile (myname, outfile);
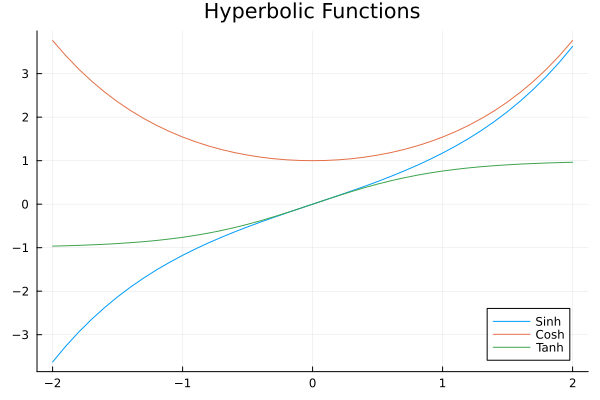
0088 | for d in 0 .. 40 loop
0089 | x := Float (d) * 0.1 - 2.0;
0090 | Put (x'Image);
0091 | Put (" ; ");
0092 | Put (Elementary_Functions.Sinh (x), Fore => 3, Aft => 3, Exp => 0);
0093 | Put (" ; ");
0094 | Put (Elementary_Functions.Cosh (x), Fore => 3, Aft => 3, Exp => 0);
0095 | Put (" ; ");
0096 | Put (Elementary_Functions.Tanh (x), Fore => 3, Aft => 3, Exp => 0);
0097 | Put (" ; ");
0098 | New_Line;
0099 | end loop;
0100 | Close (outfile);
0101 | Set_Output (Standard_Output);
In this fragment, it can be seen that the floating point variables are directly printed instead of using the built in Image attribute. Direct print then affords the control over the format of the print out. The output generated by the above fragment illustrates this:
Step response in the time domain gives an overview of the step response in the time domain of a capacitor and a resistor. Given a circuit with a resistor and a capacitor in series, generate the voltages across each component when a DC voltage is applied in a CSV file to enable plotting.